
Plotting with Matplotlib
Plotting with matplotlib is really confusing. Understanding how it works under the hood helps to alleviate this pain enormously. This short blog post is here to help you on the way to matplotlib enlightenment.

Let’s jump right in!
>>> import matplotlib.pyplot as plt
Key takeaways
- It is useful to understand object hierarchy that matplotlib uses
- What we think of as a “figure” is an Axes object in matplotlib terminology
ax.plot(),plt.plot(), etc. are all wrappers for the same functionality
Understand the matplotlib object hierarchy
The first thing one must understand is the object-oriented hierarchy that matplotlib uses. Without having a clear picture of this hierarchy in mind, the terminology that matplotlib uses is very confusing.
The following image clearly illustrates the object hierarcy that is used.
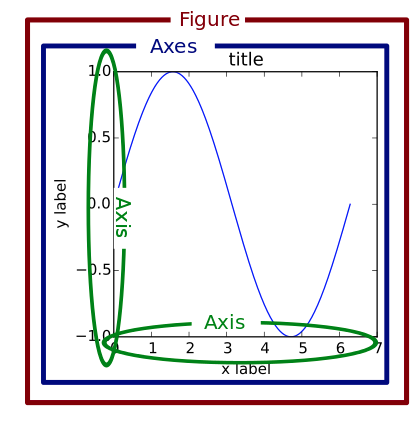
The object hierarchy is as follows:
- A Figure object can be thought of as the box or outermost container for any matplotlib graphic.
- A Figure object can have multiple Axes objects. This thing right here is what makes the terminology so confusing, think of the Axes object simply as an individual plot or graph.
- An Axes object has two Axis objects (x-axis and y-axis)
- A Figure object can have multiple Axes objects. This thing right here is what makes the terminology so confusing, think of the Axes object simply as an individual plot or graph.
Basically, the hierarchy is as follows: Figure, Axes, Axis and all other stuff that goes on a plot. The Figure object can be thought of as the external container. This container can have multiple Axes objects. Basically it all boils down to this:
Your Axes object is what you would normally think of as a single “figure”.
Realise that you are really only manipulating one Axes (this is not a typo)
With this object hierarchy and terminology firmly in place, we can get to the crux of the problem. You have to realise the following key concept:
“[With pyplot], simple functions are used to add plot elements (lines, images, text, etc.) to the current Axes in the current figure.” [emphasis added]
The key point here is that you are only manipulating one Axes object at a
time. Functions like gca() refer to getCurrentAxes() which basically
grabs the current Axes so you can work on it.
Example
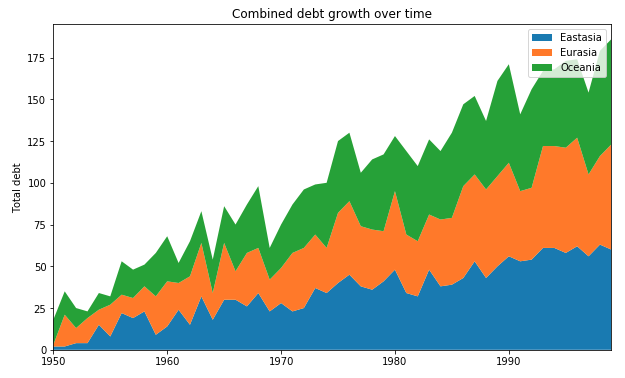
Running the following piece of code (source) results in the following image.
import matplotlib.pyplot as plt
import numpy as np

rng = np.arange(50)
rnd = np.random.randint(0, 20, size=(3, rng.size))
yrs = 1950 + rng
labels = ['Eastasia', 'Eurasia', 'Oceania']

fig, ax = plt.subplots(figsize=(10,6))
ax.stackplot(yrs, rng + rnd, labels=labels)
ax.set_title("Combined debt growth over time")
ax.legend(loc='best')
ax.set_ylabel("Total debt")
ax.set_xlim(xmin=yrs[0], xmax=yrs[-1])
plt.show()
With our newfound knowledge we can better understand what really happens in this simple plotting exercise.
# Create Figure/Axes object (and set Figure size)
fig, ax = plt.subplots(figsize=(10,6))
# On the Axes object called ax, make a stackplot
ax.stackplot(yrs, rng + rnd, labels=labels)
# On the Axes object called ax, set the title
ax.set_title("Combined debt growth over time")
# On the Axes object called ax, ... you get it now ...
ax.legend(loc='best')
...
Extra: Deep dive into matplotlib source code
The matplotlib source code is actually open source so we can dive into the code and see what actually happens.
We ask ourselves: what really happens when we add the legend the Axes object?
ax.legend(loc='best)
We look in the docs for matplotlib.pyplot.legend. The documentation clearly states (in language we understand now!): “Place a legend on the axes.” Where “axes” refers to the Axes object, which can trip you up if you’re not familiar with the terminology.
Searching for the legend function in the source code we come across this piece of code.
# Autogenerated by boilerplate.py.  Do not edit as changes will be lost.
@docstring.copy(Axes.legend)
def legend(*args, **kwargs):
    return gca().legend(*args, **kwargs)
Huh, so calling Axes.legend actually returns gca().legend() with arguments. But what is gca() then?
def gca(**kwargs):
    """
    Get the current :class:`~matplotlib.axes.Axes` instance on the
    current figure matching the given keyword args, or create one.

    Examples
    --------
    To get the current polar axes on the current figure::

        plt.gca(projection='polar')

    If the current axes doesn't exist, or isn't a polar one, the appropriate
    axes will be created and then returned.

    See Also
    --------
    matplotlib.figure.Figure.gca : The figure's gca method.
    """
    return gcf().gca(**kwargs)
Interesting. So by trying to add the legend to the Axes object, we try to grab the current Axes object and then try to add the legend to that. But, this function is simply a wrapper on gcf() and one more layer down the rabbit hole we go.
def gcf():
    """
    Get the current figure.

    If no current figure exists, a new one is created using
    `~.pyplot.figure()`.
    """
    figManager = _pylab_helpers.Gcf.get_active()
    if figManager is not None:
        return figManager.canvas.figure
    else:
        return figure()
Finally, we either create a new figure or find the current one. Wew. That went one, two, three layers deep. Let’s dive back up and recap what exactly happens when we try to add a legend to our Axes object (our “figure”).
# We try to add the legend to the Axes object
ax.legend(loc='best')
# This tries to grab current axes, gca(), and add it
gca().legend(loc='best')
# gca() tries to grab the current figure, gcf()
gcf().gca().legend(loc='best')
# We add the legend on the Figure > Axes > legend hierarchy
figManager.canvas.figure.gca().legend(loc='best')
That’s it!
Conclusion
If I were to leave you with just three things to remember from this post, I’d tell you these three:
- Matplotlib terminology is confusing, just remember that your Axes object is basically a plot.
- Keep in mind the Matplotlib object hierarchy (Figure, Axes, Axis)
- Realise that you are only really manipulating one Axes at a time!


Comments